Reports menu options
- Coding comparison - for text files (compares 2 coders)
- Coding comparison by file - for text files (compares 2 coders)
- Code counts by file/case
- Code frequencies (totals of applied codes)
- File summary (details of a file and its coded segments)
- Code summary (details of a code and associated files)
- Charts (Display statistical and other charts in a web browser)
- Database Queries (Database querying, including default queries)
Coding Comparison Report
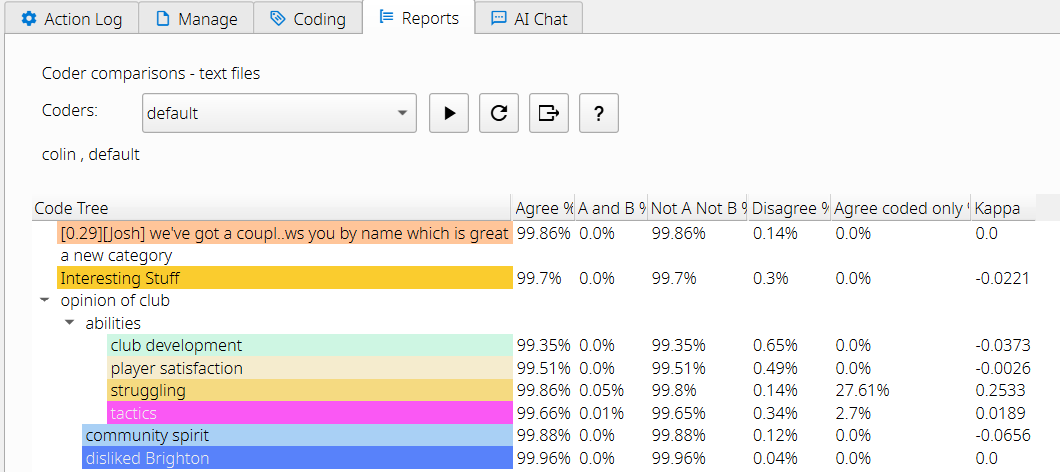
This option shows the overall similarities and differences between two coders across all text files. Select two coders and click the run comparisons button. The statistics created here are only for coded text, not coded image nor media files.
For each code:
Agreement % shows agreement for a combination of coded and non-coded text characters.
A and B % shows agreement for only the coded text characters divided by the total characters in the text.
Not A and Not B % shows the total of the uncoded text divided by the total characters in the text.
Disagree % shows the percentage of all the coded and non-coded text that did not match between coders. It is the same as 100 – the Agree %.
Agree coded only % shows the percentage of all the dual-coded text divided by single plus dual-coded text.
Cohen’s Kappa is calculated based on the information in Wikipédia.
Buttons to run the comparisons, to clear the coders selected, to export to Excel, and to open a statistics help window.
Coding Comparison by file Report
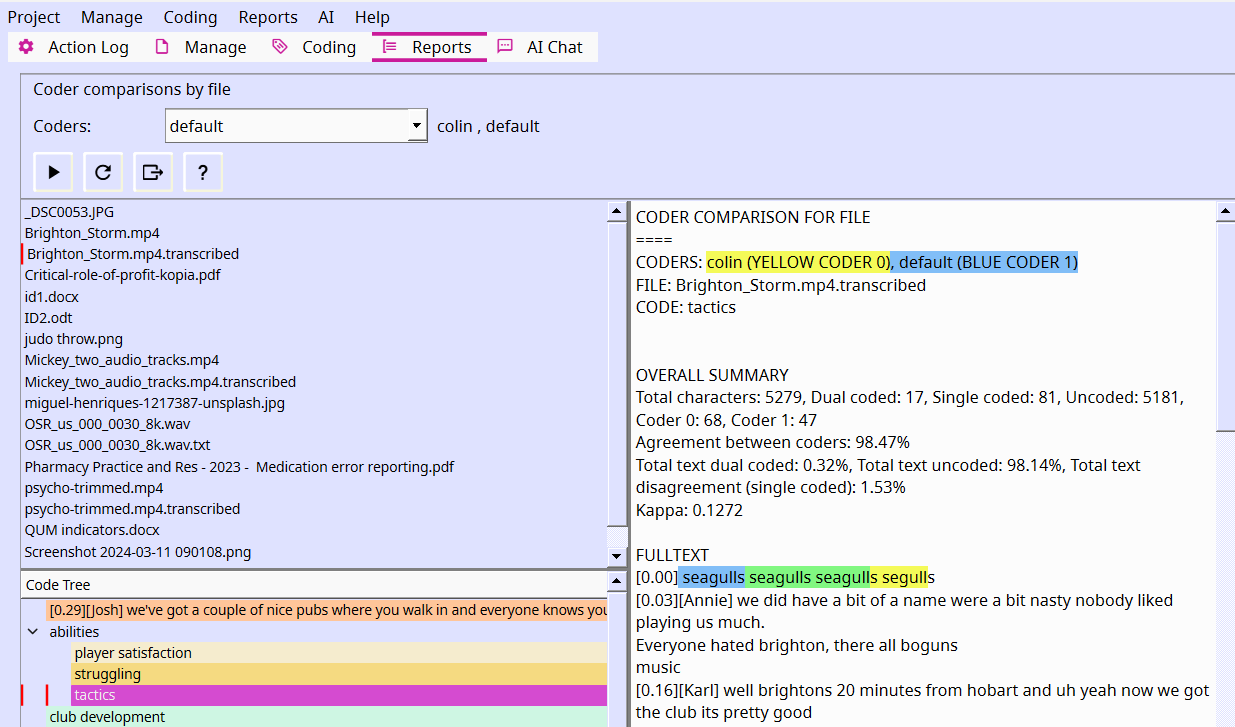
This option shows the overall similarities and differences between two coders in ONE selected file. Select one file, one code, and two coders. Then click the run comparisons button. The statistics and comparisons for audio/video coded segments are in development. Overall agreement, disagreement, and Cohen's Kappa are calculated for text and images. An image file is displayed in a separate window, showing the two coders' selections in yellow or blue-boxed areas. Green text indicates where both coders coded the same section of text. Mouse hover provides additional information.
Code frequencies Report
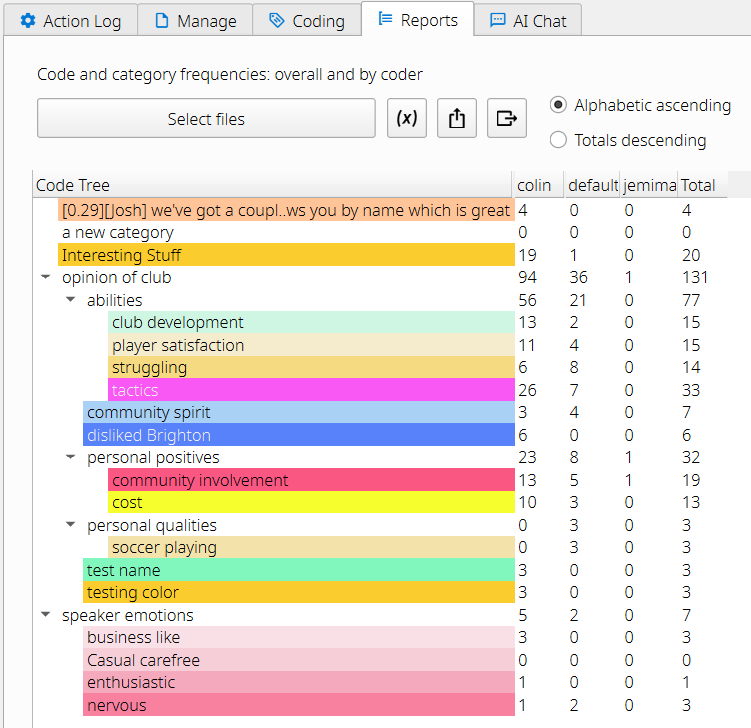
This window shows all the codes and categories and the frequency of use for each coder. Code frequencies can be selected for specific files.
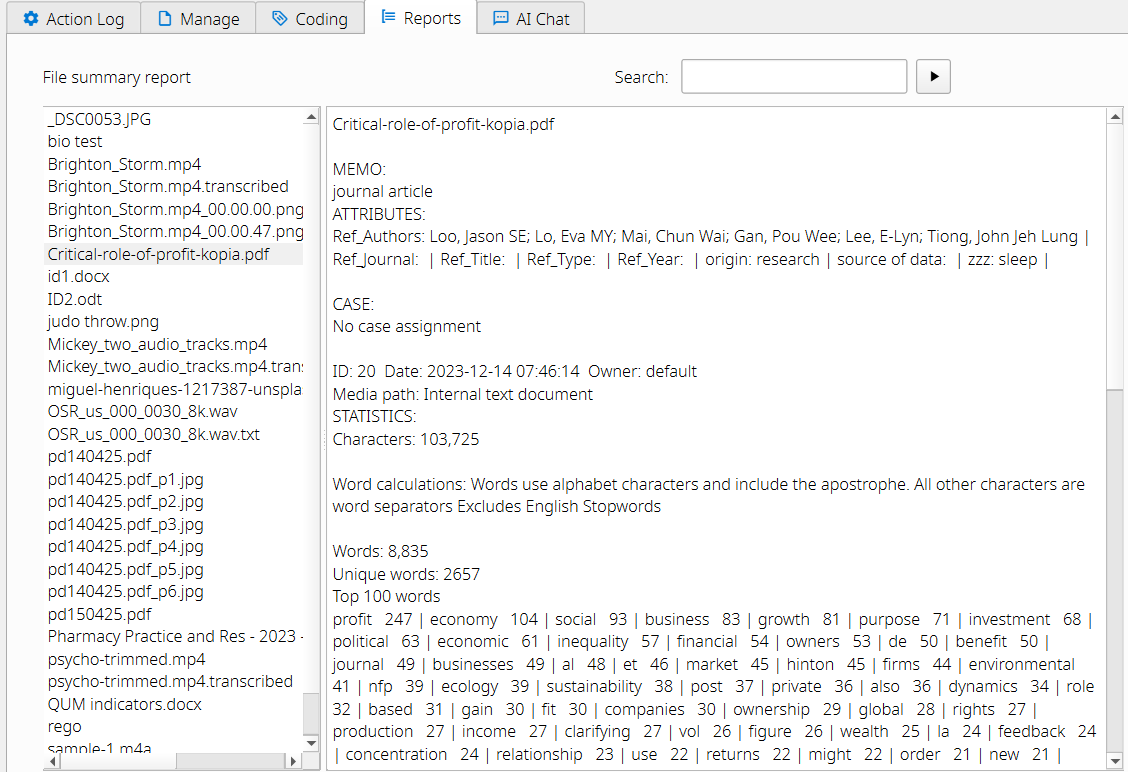
File Summary Report
Click on a file to get a summary of that file. It describes media metadata, characters and word frequency. Attributes. It summarises the count of codes for that file. The text codings summarize the average text length. For image codings it summarises the average pixel area. For audio/video codings it summarises the average segment length.
The top 100 words have stopwords applied - so common filler words such as 'a ', 'the', etc. are excluded. See the list in the Examples folder. You can override this list by providing your own stopwords text file and placing this in the .qualcoder folder.
Code Summary Report
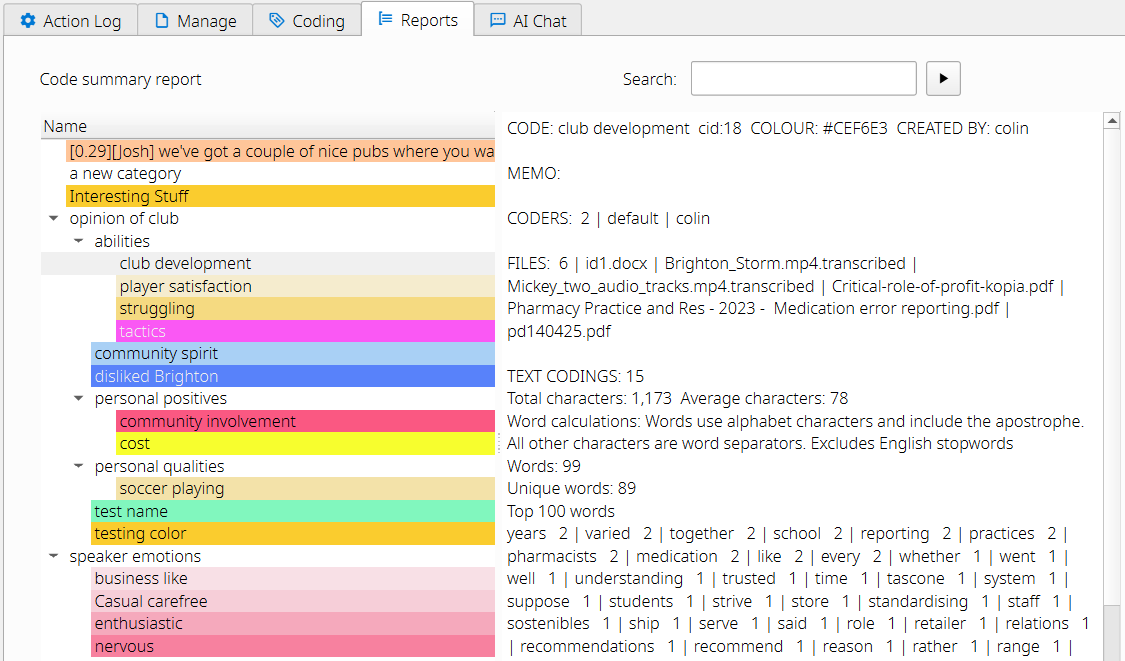
Click on a code to get a summary of that code. The coders who have used the code. The number of codings in text, image and audio/video media. The text codings summarize the average text length and the most common words. For image codings it summarises the average pixel area. For audio/video codings it summarises the average segment length.
The top 100 words have stopwords applied - so common filler words such as 'a ', 'the', etc. are excluded. See the list in the Examples folder. You can override this list by providing your own stopwords text file and placing this in the .qualcoder folder.
Charts
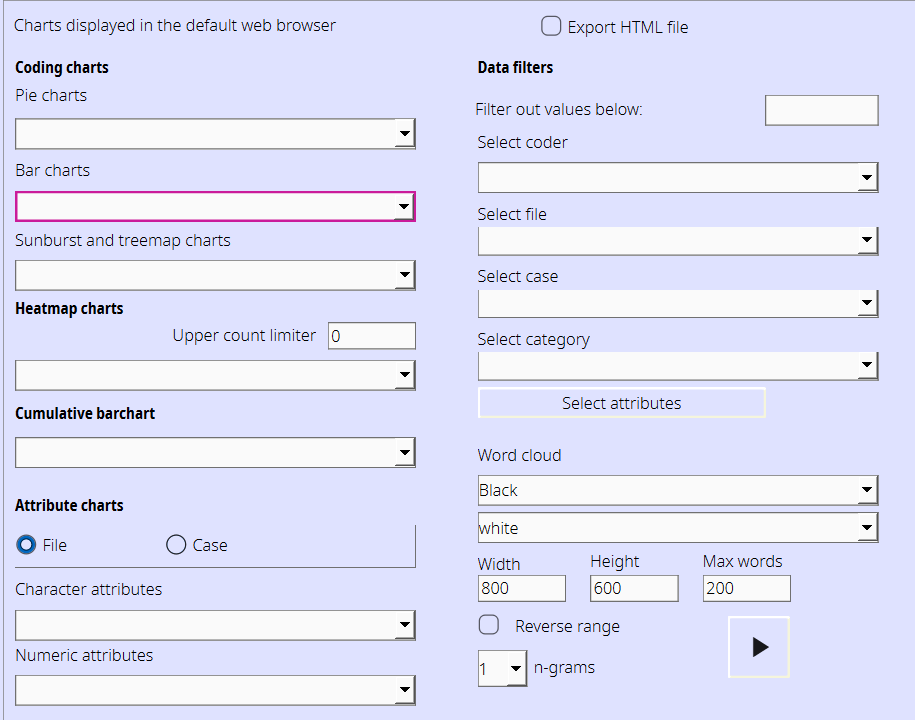
Various chart types and filter options are available.
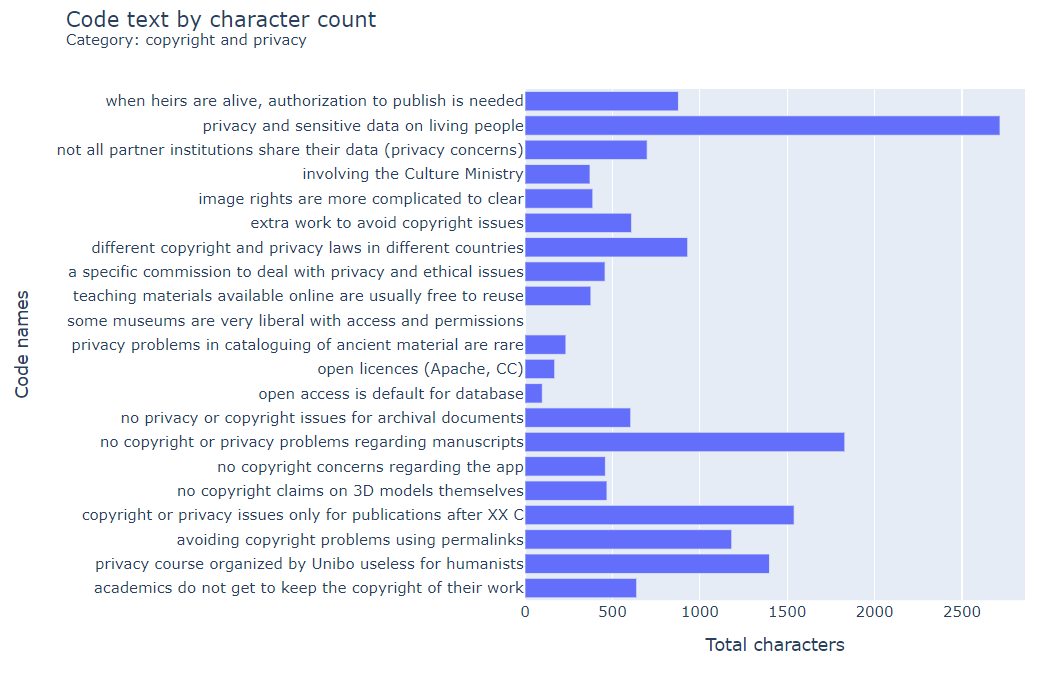
Pie, Bar, Sunburst and Treemap charts can be created.
Charts, except for the WordCloud, are displayed in the default web browser. If the browser is not displaying your chart, first change your default web browser to another recent browser, e.g. Chrome or Edge or Safari. If you have javascript switched off the charts will not display. Checking the Export html file box will make all charts be exported to the Default export folder as an html file.
Heatmaps of files or cases against codes can be created. These are limited to 40 rows and columns for quicker rendering and better visibility.
Chart selections
Bar chart
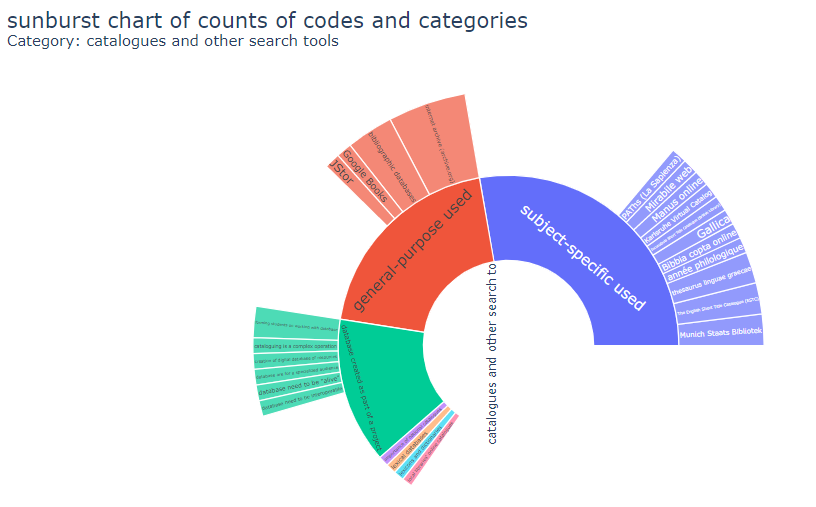
Sunburst chart
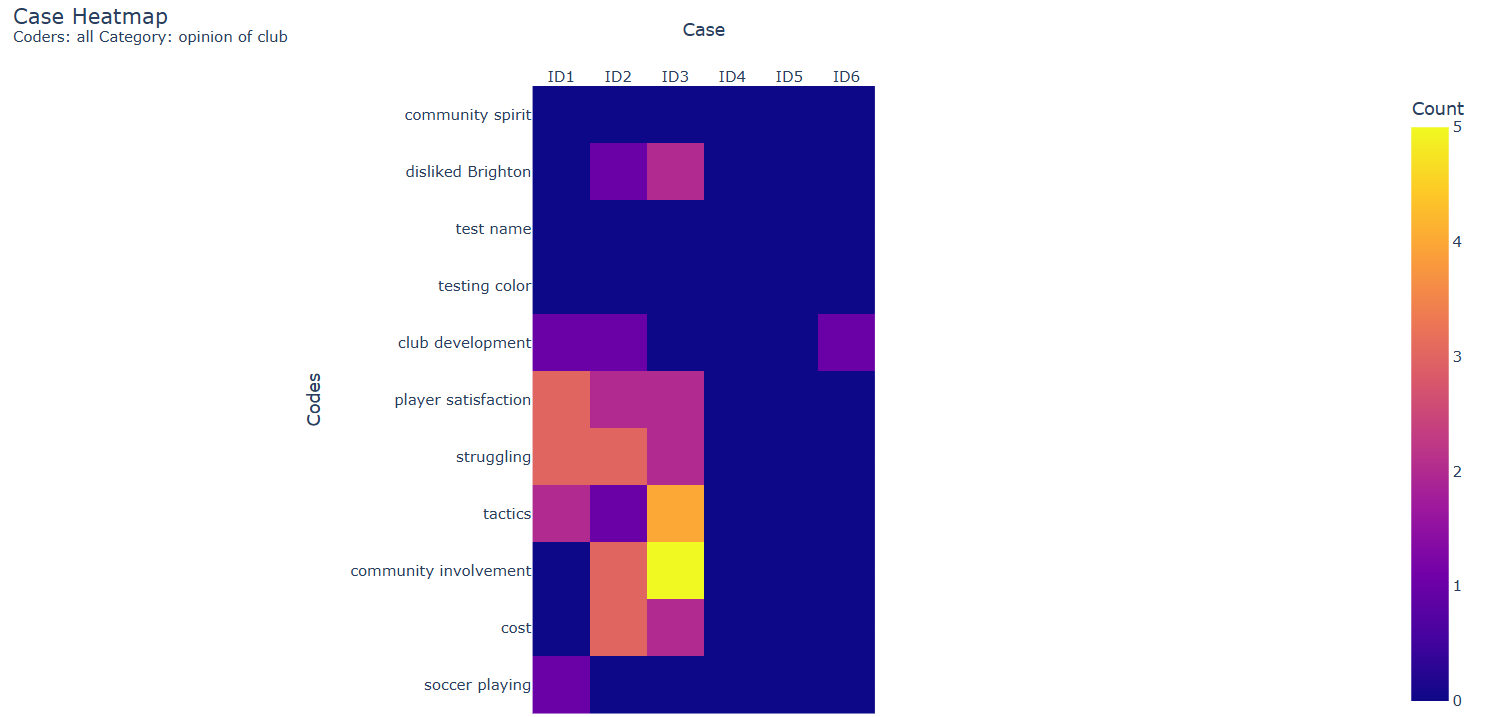
Heatmap
Of files or cases by codes, and shows code frequency heat.
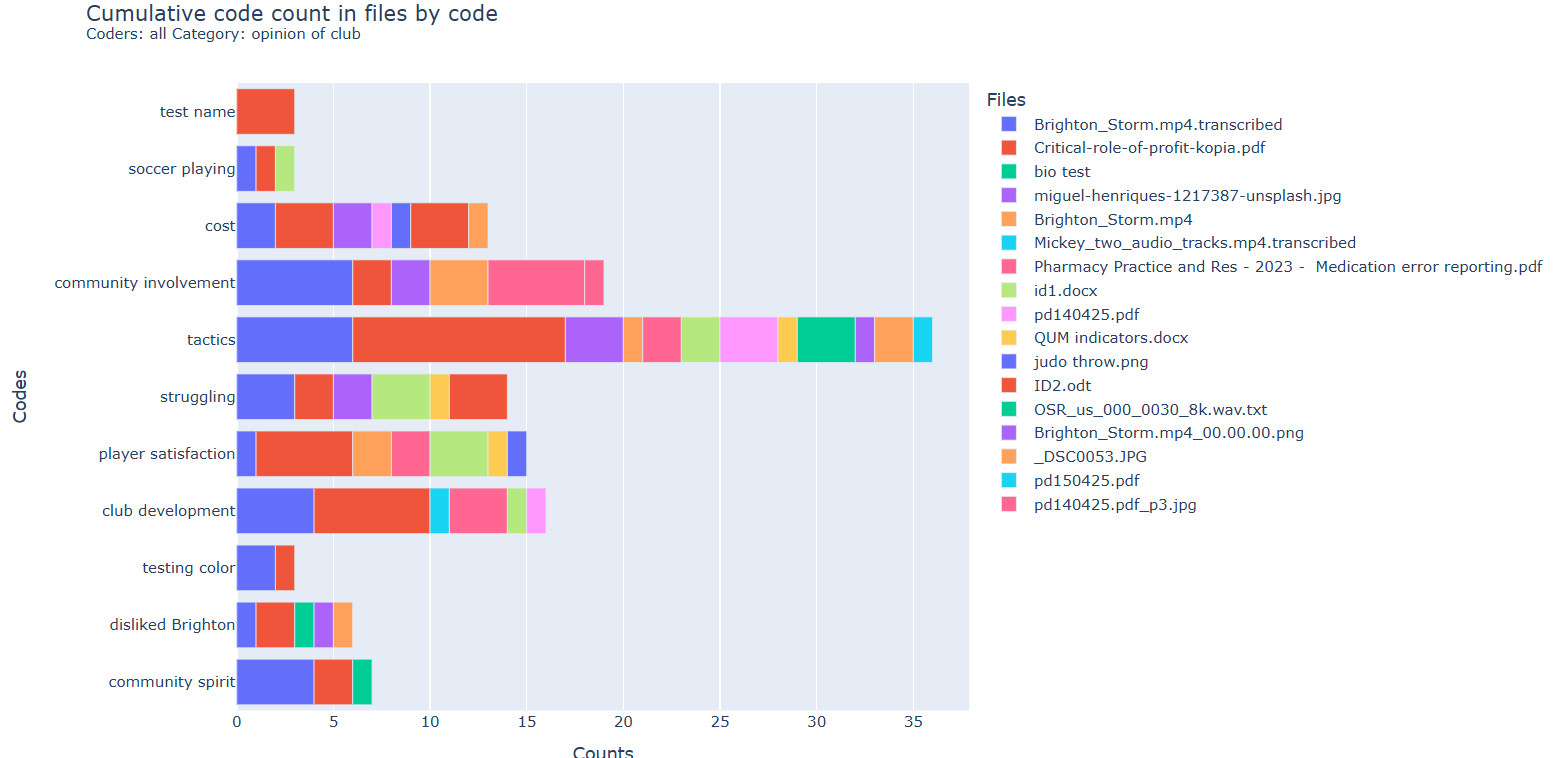
Stacked bar charts
Of files or cases by codes, and shows code frequency as a stacked bar chart.
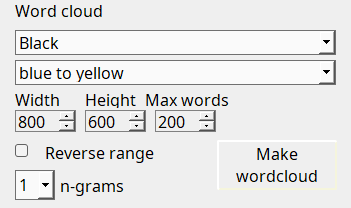
Word cloud
A word cloud is available with different options for background colour, foreground colour or colour range, rectangle size, number of words (n-grams) from 1 to 4, and maximum number of words to include. The maximum words is determined by the most frequent to the least frequent and changing this option will change how crowded or sparse the word cloud appears.
There are a list of stop words that are used to exclude common words from the word cloud display (e.g. an, a, the). This can be overridden by creating your own stopwords.txt file with one word on each line. This file should be put inside the .qualcoder folder. e.g. on Windows:
"C:\Users\yourname.qualcoder"
The stopwords currently used are in stopwords.txt in the Examples folder. Alternatively, in 3.8+, you can use the button in the Wordcloud section to temporarily link to another stopwords file of your choosing.

Database queries
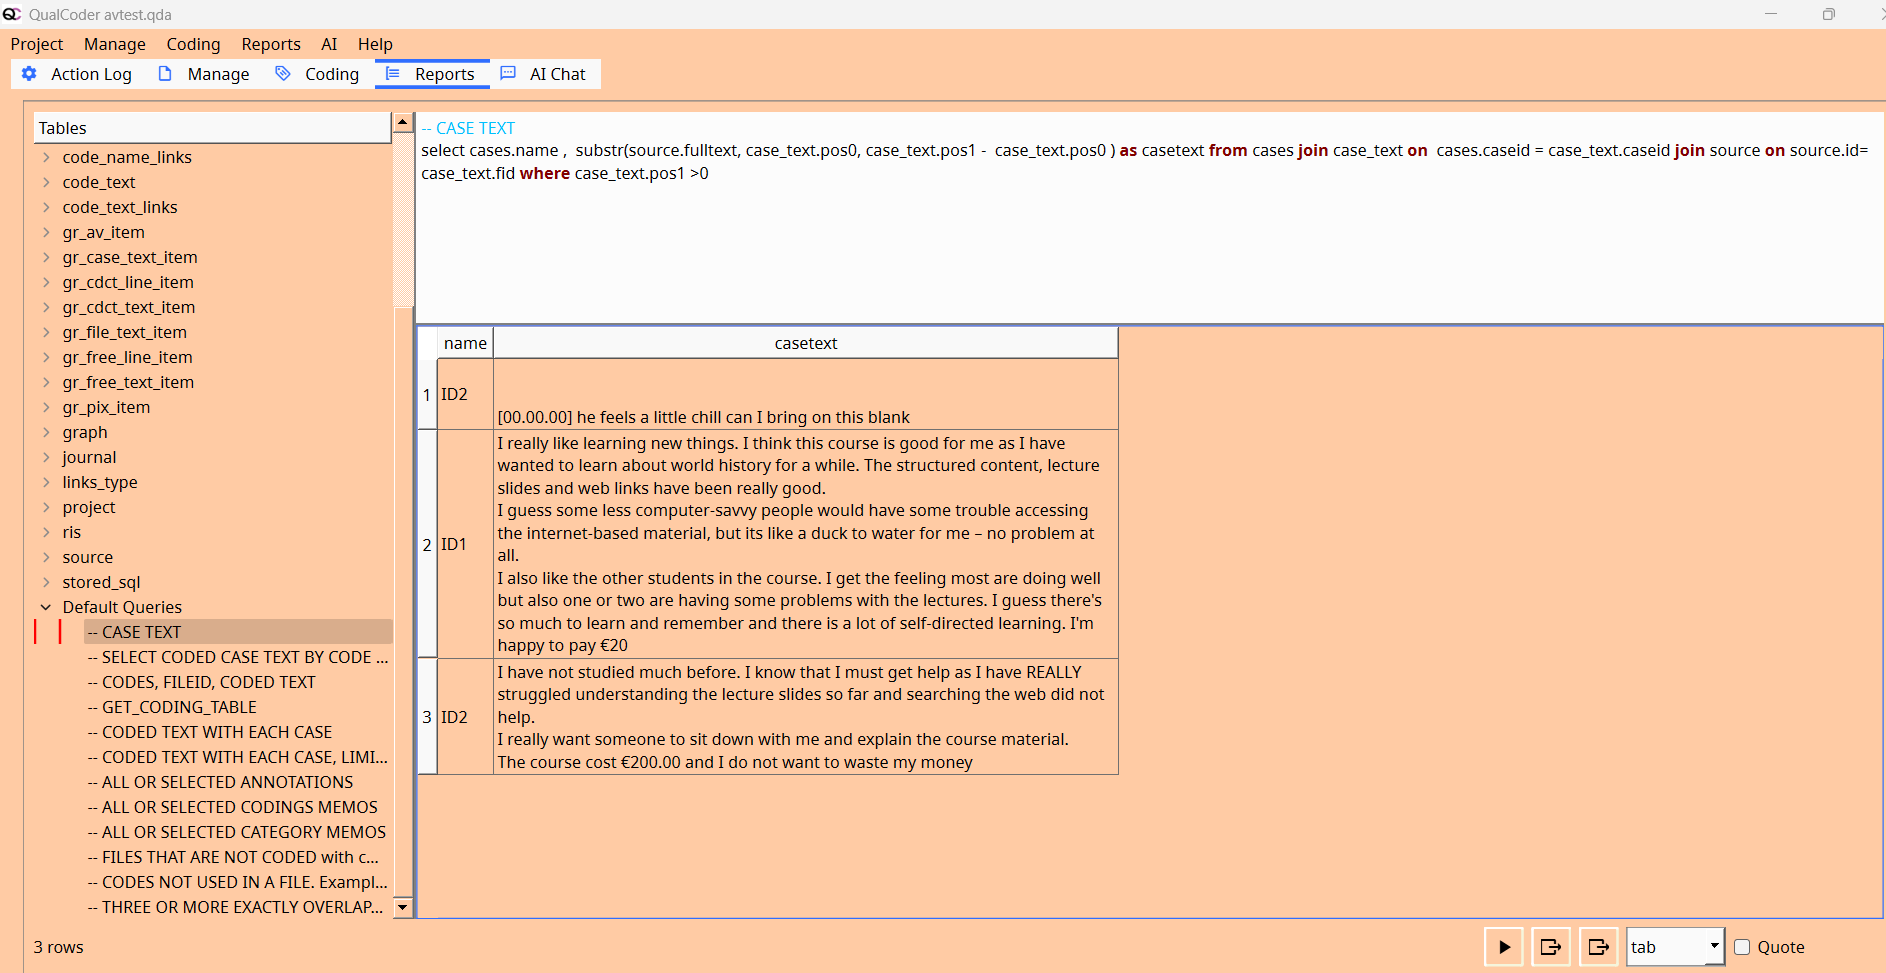
Apply SQL Statements to query the data.
This window contains three panes. The top pane is where SQL statements are entered and the bottom pane contains the results of queries. The left pane contains tables and field names. Double-clicking on a field name adds it to the SQL statement. Results can be exported to a delimited file. If you are not familiar with SQL take care as you will be able to update and delete the data as well as select data. Note: Some Unicode symbols are not converted to plain text and are ignored.
There are several prepared statements listed:
- Case text
- Coded text using a case attribute selection (v3.6+)
- Codes fileid and coded text
- Get coding table - an implementation of an RQDA function that returns the code name, table, text length and text start and end positions.
- Coded text with each case
Most table fields are text. The following fields are integer: anid, avid, attrid, caseid,catid, cid, fid, id, imid, jid, pos0,pos1, x1, y1, width, height.
Right-click in the results table for filtering options.
Right-clicking in the SQL window gives you various options such as select all, copy, and paste.
At the bottom of the left-hand side list, you can see: stored sql and Default queries
Stored sql are your own created and stored sql statements. To store a sql statement, right-click on the sql and choose 'save query'.
Default queries, such as the one shown in the image, are ready-made SQL queries to perform additional extracts from your data. They are commented '-- a comment' to describe what each statement does.